
A customer journey map is the story of how a user moves from being a stranger to a paying customer. It's not just a marketing flowchart; it’s a diagnostic tool that shows you exactly why good leads are dropping off and where your booking or enquiry process is bleeding money. By visualising their path, you can pinpoint the UX issues that directly damage conversions and revenue.
Why Your Booking Funnel Is Leaking Revenue
High website traffic but low conversion rates are a familiar frustration. For tourism operators, SaaS companies, and professional service firms, the common reaction is to pour more money into ads. But this rarely fixes the underlying problem: a disconnected and frustrating user experience that kills conversions before they happen.
You assume your booking process is simple. To a potential customer, it’s often a series of invisible walls. These friction points—a confusing pricing page, a clunky checkout form, or a slow-loading mobile site—are enough to make them abandon the process and go straight to a competitor. Every time that happens, it's a direct commercial loss.

From Guesswork to Evidence-Based Decisions
The biggest mistake businesses make is designing a customer path based on how they think it should work, not on how users actually behave online. A customer journey map forces a critical mindset shift, moving you from "we need more traffic" to "we need to convert the traffic we already have." It becomes a strategic blueprint that connects every user action, thought, and feeling to specific touchpoints. To understand why your funnel is leaking, you must analyze website traffic with a focus on turning clicks into bookings.
A journey map replaces guesswork with an evidence-based view of your customer’s reality. It is the most direct way to understand the 'why' behind the drop-off rates you see in your analytics.
The Commercial Case for Journey Mapping
Mapping the customer journey is a commercial activity, not a theoretical exercise. It's about finding specific, high-impact opportunities to increase revenue. It helps you answer the tough questions that directly impact your bottom line:
For Tourism Operators: At what exact step do people abandon their holiday booking? Is it when they see surprise fees, or when the payment options are too limited? A single point of friction here directly costs you a booking.
For SaaS Companies: Where in the free trial onboarding do users get stuck? If they can't experience the product's core value quickly, they won't convert to a paid plan, damaging your MRR growth.
For Professional Services: Why are qualified prospects landing on your 'Contact Us' page but never submitting an enquiry? A form that is too long or intrusive directly reduces your pipeline of qualified leads.
By visualising the entire process, you stop wasting marketing spend and start plugging the leaks in your conversion funnel. As our guide on improving your booking flow blueprint shows, small UX tweaks discovered through journey mapping can lead to major revenue wins.
Is Your Website Losing Bookings or Leads?
A customer journey map is the first step, but a professional UX audit gets to the root cause fast. Our UX Snapshot service is designed for busy leaders who need to identify the biggest conversion gaps on their website without a lengthy, expensive project.
Find Your Conversion Gaps Fast with a UX Snapshot
What Is A Customer Journey Map And Why It Matters For Conversions
Let's cut through the jargon. A customer journey map is not a complex technical diagram. It's a visual story of your customer's experience, told entirely from their perspective. This tool forces you to step outside your own business and see your booking or enquiry process through their eyes—revealing what they’re actually doing, thinking, and feeling at each step.
A common mistake is assuming the customer's path is a straight line. It never is. Your analytics might show you where users are dropping off, but a journey map tells you why. It points out the confusing pricing table, the slow-loading page, or the poorly worded call-to-action that made them give up.
This is the difference between guessing at solutions and making CRO fixes that actually lift your conversion rates and revenue.
From Vague Metrics To Actionable Insights
Your analytics dashboard can tell you 30% of users abandon your booking form. That’s the "what." A journey map, informed by user testing and heatmaps, uncovers the "why." It might reveal that people get frustrated trying to compare package options on mobile, or they feel anxious when asked for credit card details too early in the process.
This is where the map becomes a powerful commercial tool. It draws a straight line between user friction and lost revenue, providing a clear mandate for what to fix first. The value of this connection is becoming widely understood; the New Zealand Customer Journey Analytics Market is now worth around USD 30 million. This shows how critical it is for local organisations to reduce friction in their conversion funnels. You can read the full research on the NZ market to understand the scale.
A customer journey map translates anonymous clicks into a human story. It shows you the precise moments of frustration that kill trial-to-paid conversions, reduce lead quality, and cause booking abandonment.
Key Components Of A Conversion-Focused Journey Map
A useful map is more than a timeline. To be a real diagnostic tool for your conversion funnel, it must layer several key pieces of information. This gives you a complete picture of the customer’s experience.
By visualising these components, your journey map becomes a strategic roadmap for your conversion optimisation programme.
How To Build Your Customer Journey Map Step-By-Step
Building a powerful customer journey map isn't about brainstorming in a boardroom. It's a structured process grounded in UX best practice that replaces internal assumptions with customer reality. Following these steps ensures you create an actionable tool that boosts conversions, not a decorative poster.
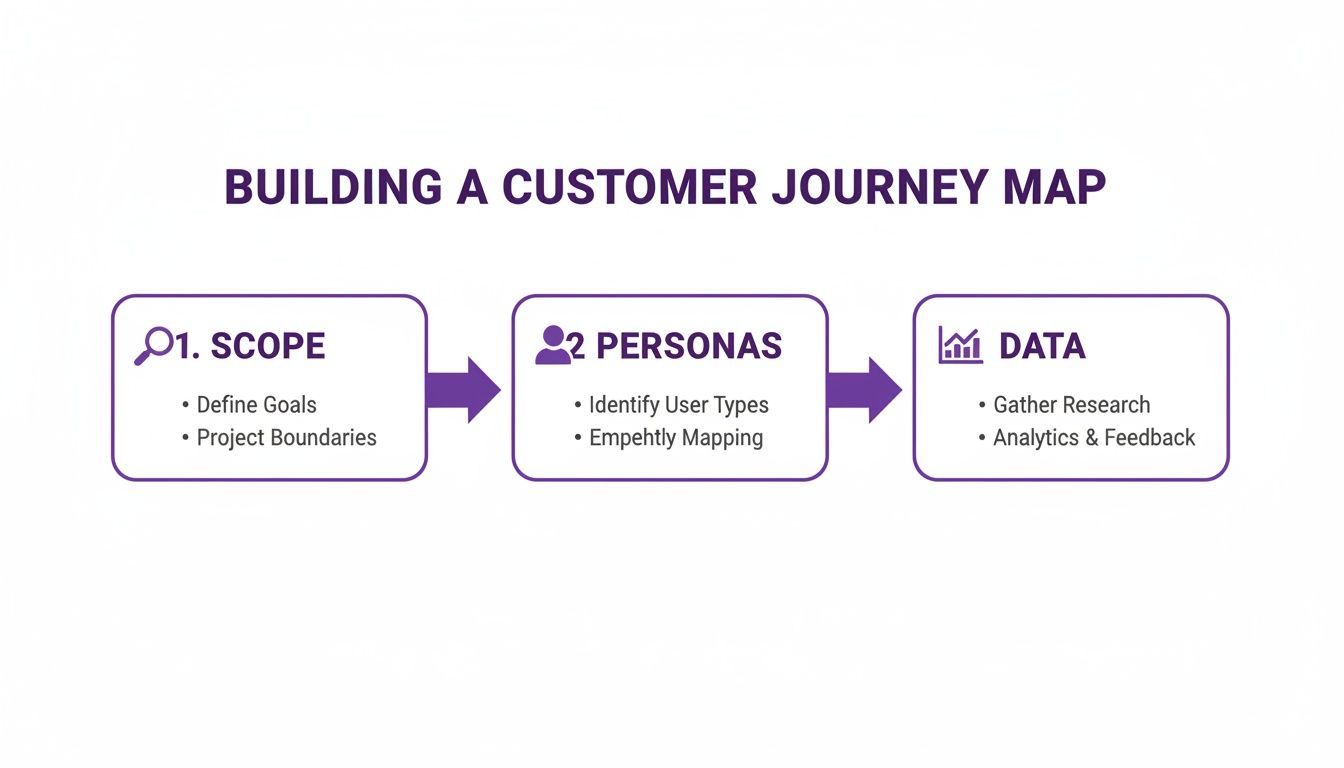
Step 1: Define Your Scope and Goal
First, you can't map everything. A map that tries to cover every possible interaction becomes a tangled mess, too broad to be useful. Focus on a specific, high-value path tied to a clear commercial goal.
SaaS Example: Map the journey from 'free trial sign-up' to 'first key feature activation'. Goal: Reduce trial user churn by identifying onboarding friction.
Tourism Example: Map the path from 'viewing a tour package' to 'booking completion'. Goal: Reduce cart abandonment by finding UX flaws in the checkout flow.
Services Example: Map the experience from 'reading a case study' to 'submitting a qualified enquiry'. Goal: Improve lead quality by understanding what builds trust.
Setting a sharp goal ensures your mapping efforts are aimed squarely at a real business problem.
Step 2: Develop a Data-Driven User Persona
A journey map without a protagonist is just a collection of data points. That protagonist is your user persona—a semi-fictional character built from real data about your primary customer. Resist the urge to create personas from guesswork. A strong persona is built from evidence.
Analytics: Dive into your Google Analytics demographic and behavioural data to understand who your users are.
Customer Surveys: Ask customers directly about their goals, motivations, and the challenges they face.
Sales & Support Logs: Analyse call logs and support tickets for common questions, complaints, and frustrations. Your customer-facing teams are a goldmine of insight.
Your persona should capture their goals, motivations, and the core problem they’re trying to solve. This keeps the entire process anchored to customer reality.
Step 3: List All Customer Touchpoints
Now, walk in your persona’s shoes. List every single point of interaction they have with your business during the journey you defined in Step 1. A touchpoint is any moment a user engages with your brand, online or off.
For a tourism operator, the list might include:
Sees a targeted Facebook ad
Reads a travel blog mentioning the tour
Visits the homepage from a search
Uses the site’s search function
Compares different tour packages
Reads customer reviews
Adds a tour to the cart
Enters payment details
Receives a booking confirmation email
Mapping these out reveals the true complexity of the journey and highlights every opportunity to influence their decision.
Step 4: Gather Data To Understand The Experience
This is where you overlay your touchpoints with real data to understand what’s really going on. This step gives your map its diagnostic power, turning it from a guess into a tool.
A journey map based only on assumptions is a work of fiction. A map validated with real user data is a strategic blueprint for conversion optimisation.
Combine data sources for a complete picture:
Quantitative Data (The 'What'): Use analytics to track user flows, page drop-off rates, and conversion funnels. This shows you where the problems are.
Qualitative Data (The 'Why'): Use tools like Hotjar or Microsoft Clarity to watch session recordings and analyse heatmaps. Conduct user testing sessions and UX audits. This tells you why the problems are happening.
This evidence-based approach is crucial in digitally savvy markets. With over 90% of New Zealanders active online, businesses can capture a rich digital footprint to build a detailed, data-driven picture of the customer journey. You can discover more insights about NZ online consumer behaviour to see the scale of this opportunity.
Step 5: Visualise The Map and Identify Opportunities
With your data gathered, assemble the map. A simple grid works best. Put your journey stages along the top (e.g., Awareness, Consideration, Booking). Then, for each stage, fill in the rows:
Actions: What is the user doing? (e.g., 'Compares pricing tiers').
Thoughts: What questions are on their mind? (e.g., 'Which plan has what I need? Is this good value?').
Feelings: What’s their emotional state? (e.g., 'Hopeful', 'Confused', 'Frustrated').
Pain Points: Where are they hitting a wall? (e.g., 'The pricing table is impossible to read on my phone').
Opportunities: How can you fix it? (e.g., 'Create a mobile-responsive pricing comparison table to reduce friction and increase clicks to checkout').
This visualisation draws a straight line from a specific user frustration to a concrete, testable opportunity for improvement.
Journey Map Examples For SaaS, Tourism And Services
Theory is useful, but seeing a customer journey map applied to a real business scenario makes its commercial value clear. Here are specific examples for three industries where the conversion flow is everything. Each one connects user friction directly to a measurable business outcome.
Before diving in, remember this process always starts with the same foundation: define your scope, know your persona, and gather data.
This simple flow keeps your map grounded in a commercial goal and validated by real user evidence.
SaaS Journey: From Free Trial To Paid Conversion
For a SaaS company, the trial-to-paid journey is paramount. The goal is to map the onboarding experience to find what stops users from reaching their "aha!" moment—the point where they understand your product's value.
Stage 1: Awareness & Sign-up: A user clicks a targeted ad, scans a feature page, and signs up. They’re feeling hopeful but also cautious.
Stage 2: Onboarding: They log in. An empty dashboard with no clear next step causes immediate confusion. This is a classic pain point where trials die.
Stage 3: Feature Activation: The user tries to create their first project. If the UI is clunky or instructions are vague, their emotion shifts to frustration.
Stage 4: Value Realisation: The user completes the task and sees the benefit. Now they feel a sense of accomplishment and see the product's value.
Stage 5: Conversion: The trial ends, and they get a prompt to upgrade. Having experienced real value, the decision is easy.
Pain Point to Fix: A complicated UI during initial onboarding.
Commercial Impact: By watching session recordings, a SaaS business might discover 40% of trial users bail after failing to configure their initial settings. The opportunity is clear: simplify the setup wizard to boost activation and directly increase the trial-to-paid conversion rate.
Tourism Journey: From Instagram To Booking Confirmation
For tourism operators, the journey is emotional, but it can be derailed by practical frustrations like confusing pricing or a clunky checkout. Tiny UX issues have a massive impact, as we've seen in our analysis of why tourism websites lose bookings so quickly.
Stage 1: Discovery: A potential traveller sees a stunning photo on Instagram. They feel inspired and tap the link in bio.
Stage 2: Consideration: On your site, they compare packages and dates. A confusing layout causes decision paralysis.
Stage 3: Price Validation: The user picks a tour. Hidden fees on the booking page trigger anxiety and an instant exit.
Stage 4: Booking & Payment: They start entering details. A long form that isn't mobile-friendly creates frustration.
Stage 5: Confirmation: The booking succeeds, and a clear confirmation email arrives, creating excitement.
Pain Point to Fix: Lack of transparent pricing on main package pages.
Commercial Impact: Analytics show a high drop-off on the payment page. The journey map reveals the "why": unexpected booking fees. Removing these and showing an all-inclusive price earlier reduces cart abandonment rate, directly increasing confirmed bookings.
Professional Services Journey: From Research To Qualified Enquiry
For B2B services, the goal is a high-quality lead. The journey map focuses on building trust and making it easy for a busy decision-maker to get in touch.
Stage 1: Problem Awareness: A manager realises their business has a problem and searches for solutions online.
Stage 2: Research & Vetting: They land on your website via a case study. They scan for expertise. Vague service descriptions that don't speak to their industry cause scepticism.
Stage 3: Consideration: They head to your 'Services' page to see if you’re credible. If the value isn't obvious, they bounce.
Stage 4: Taking Action: Convinced, they decide to reach out.
Stage 5: Enquiry Submission: They face your contact form. Asking for too much information creates one last point of friction, causing annoyance and abandonment.
Pain Point to Fix: A high-friction contact form with too many required fields.
Commercial Impact: The map identifies the long contact form as a major barrier. By reducing it to only three essential fields, the lead form submission rate increases, and because friction is lower for serious prospects, lead quality improves.
Common Journey Mapping Mistakes to Avoid
Creating a journey map is one thing; creating one that drives commercial outcomes is another. Too often, the final document becomes a forgotten file. This happens when teams fall into a few common traps. Avoiding these pitfalls is the difference between a pretty diagram and a powerful tool that actively boosts conversions.
Mistake 1: Mapping an Idealised Journey
This is the most frequent error: mapping the journey you want customers to take, not the messy, non-linear path they actually follow. This idealised version is fiction, based on internal assumptions, not external evidence from analytics, heatmaps, or user testing. The commercial consequence is severe: you end up running CRO experiments that solve imaginary problems, wasting time and resources.
Mistake 2: Working in a Silo
Journey mapping is not just a marketing task. When one department builds a map without input from sales, customer support, or product development, it’s guaranteed to be incomplete.
Sales knows the common objections right before a purchase.
Support hears about post-purchase frustrations every day.
Product understands the technical limitations causing friction.
Excluding them means your map will have massive blind spots, leading to a fragmented customer experience and missed opportunities to fix issues that are leaking revenue.
A customer journey map is an empathy tool. When you fail to involve the teams who speak to customers every day, you’re choosing to ignore their reality.
Mistake 3: Relying Solely on Analytics
Quantitative data from tools like Google Analytics is essential. It shows you what is happening and where people are dropping off. But it can never tell you why. The "why" comes from qualitative data—watching user testing sessions, analysing heatmap clicks, and reviewing support tickets. Analytics might show a 60% drop-off on your enquiry form. Only by watching a session recording will you see users getting frustrated by an aggressive validation error, giving up, and leaving. Without that qualitative insight, you’re just guessing at solutions.
Mistake 4: Creating a One-and-Done Document
The most tragic mistake is treating the journey map as a finished project. The map isn't the end goal; it's the starting point for your ongoing conversion optimisation programme. If it isn't regularly updated with new data and used to generate testable hypotheses for UX improvements, it’s just gathering digital dust. An effective map is a living document that fuels a continuous feedback loop for growth.
Turning Your Journey Map Into Action
A customer journey map is only valuable if it sparks change. Its real job is to be a catalyst—a blueprint for a focused, continuous optimisation programme. The goal is to move from identifying problems to systematically fixing them in a way that directly increases bookings, improves lead quality, and grows revenue.

Prioritise with an Impact-Effort Matrix
Your map has likely unearthed dozens of friction points. Don't try to fix everything at once. Use a simple Impact/Effort Matrix to prioritise ruthlessly.
High-Impact, Low-Effort: These are your quick wins. Do these first to build momentum.
High-Impact, High-Effort: These are strategic projects. Plan for them properly.
Low-Impact, Low-Effort: Tackle these when you have spare capacity.
Low-Impact, High-Effort: Ignore these. They are a resource drain.
This forces you to focus your energy where it will deliver the biggest commercial return, fast.
Translate Pain Points into Testable Hypotheses
This is the core of an action-oriented CRO approach. Turn vague customer complaints into specific, testable hypotheses for experiments. A strong hypothesis follows this structure: "If we change [X], then [Y] will happen, which we'll measure by [Z]."
Pain Point: "Users are confused by our SaaS pricing tiers."
Hypothesis: "By simplifying the pricing page layout and adding a feature comparison toggle, we will increase clicks on the 'Start Trial' button by 15%."
This connects the customer's problem directly to a business KPI. No guesswork involved.
Integrate Journey KPIs into Reporting
Finally, make your map a living part of your business by integrating its key metrics into regular team reporting. This keeps the end-to-end customer experience front-of-mind. This long-term focus is critical. The New Zealand Customer Loyalty Solutions Market, for example, has seen explosive growth, highlighting a massive shift: the journey doesn’t end at the first sale. You can learn more about NZ's loyalty market trends to see why that post-booking experience matters so much. By tracking KPIs tied to each journey stage, your map becomes the engine for a cycle of continuous improvement.
Find And Fix Your Conversion Gaps
A customer journey map shows you where your booking or enquiry process is failing. A UX Snapshot is designed for busy leaders who need to identify the highest-impact conversion gaps on their website—fast. Stop guessing and start fixing the issues that are costing you revenue. It’s the fastest way to uncover the conversion gaps in your customer journey.

Subscribe to our newsletter
Stop losing bookings, get insider tips to turn your website into a conversion machine.
More posts
Insights to help you turn more visitors into bookings, through better SEO, UX, and conversion strategy.

Marketing for B2B: A Modern Playbook for High-Growth

How Strategy and Branding Drives Conversions for NZ Businesses

How Strong Propositions of Value Drive Homepage Conversions